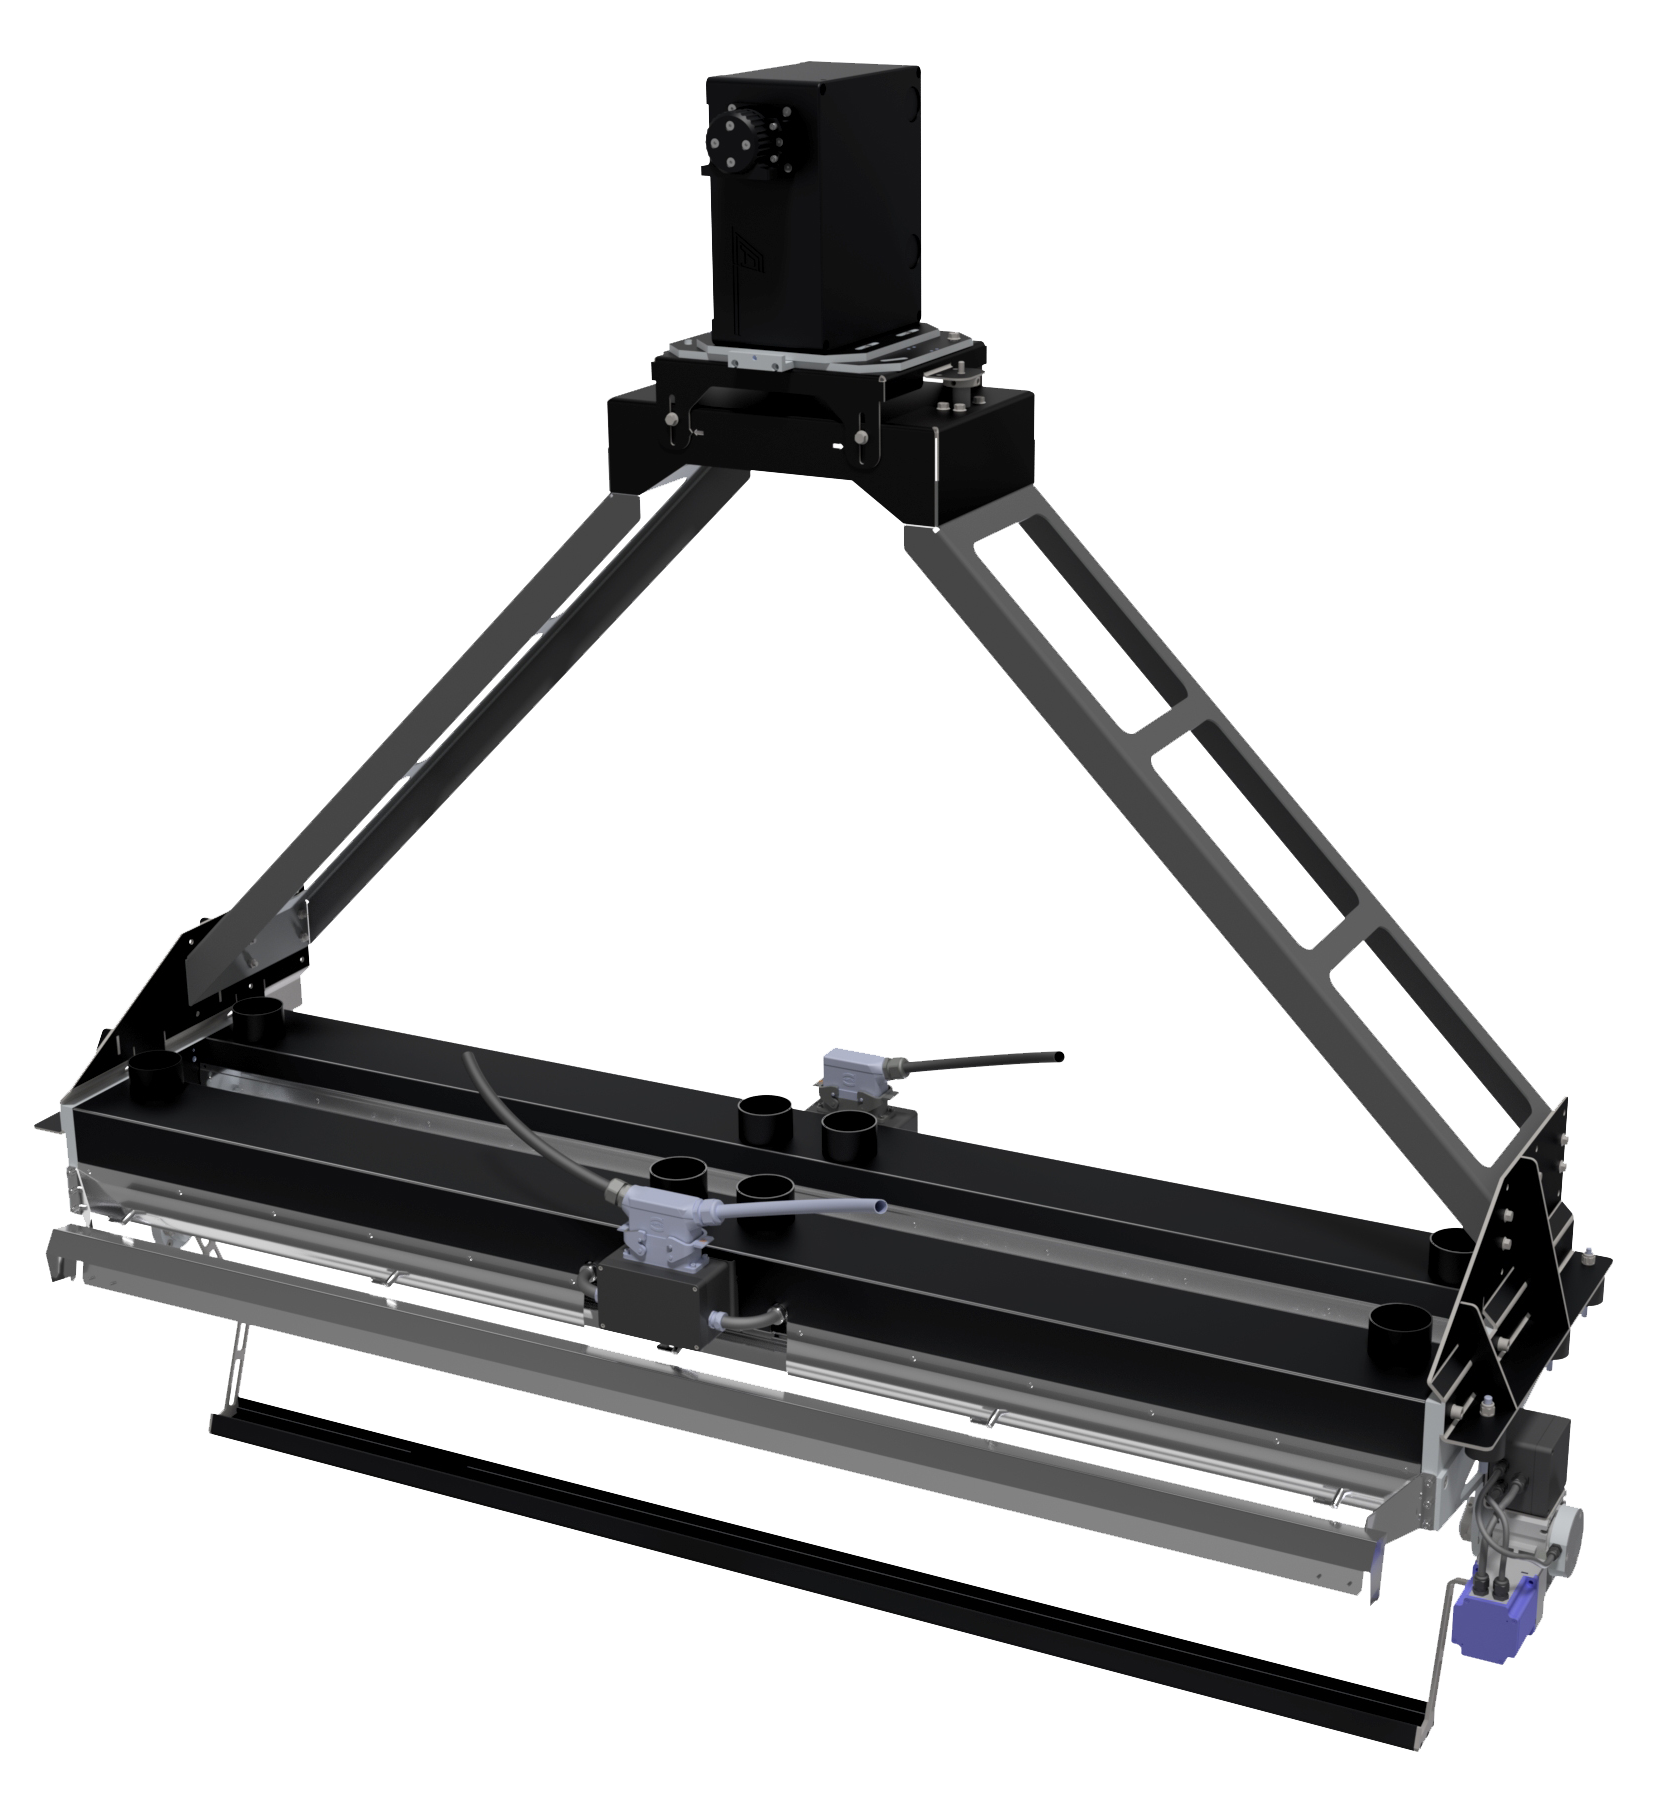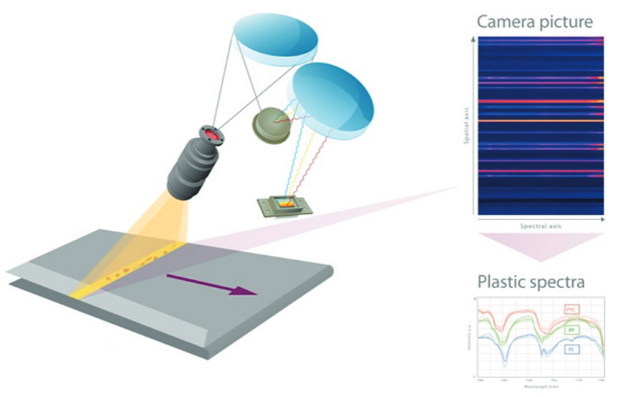
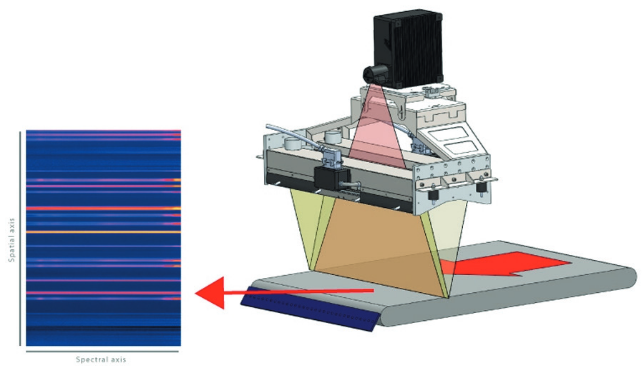

Hyperspectral cameras
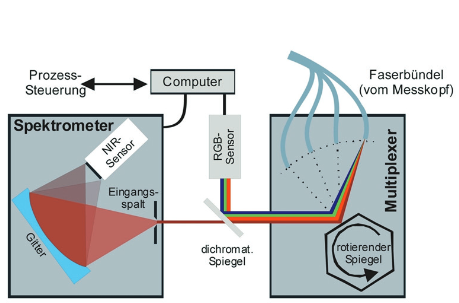
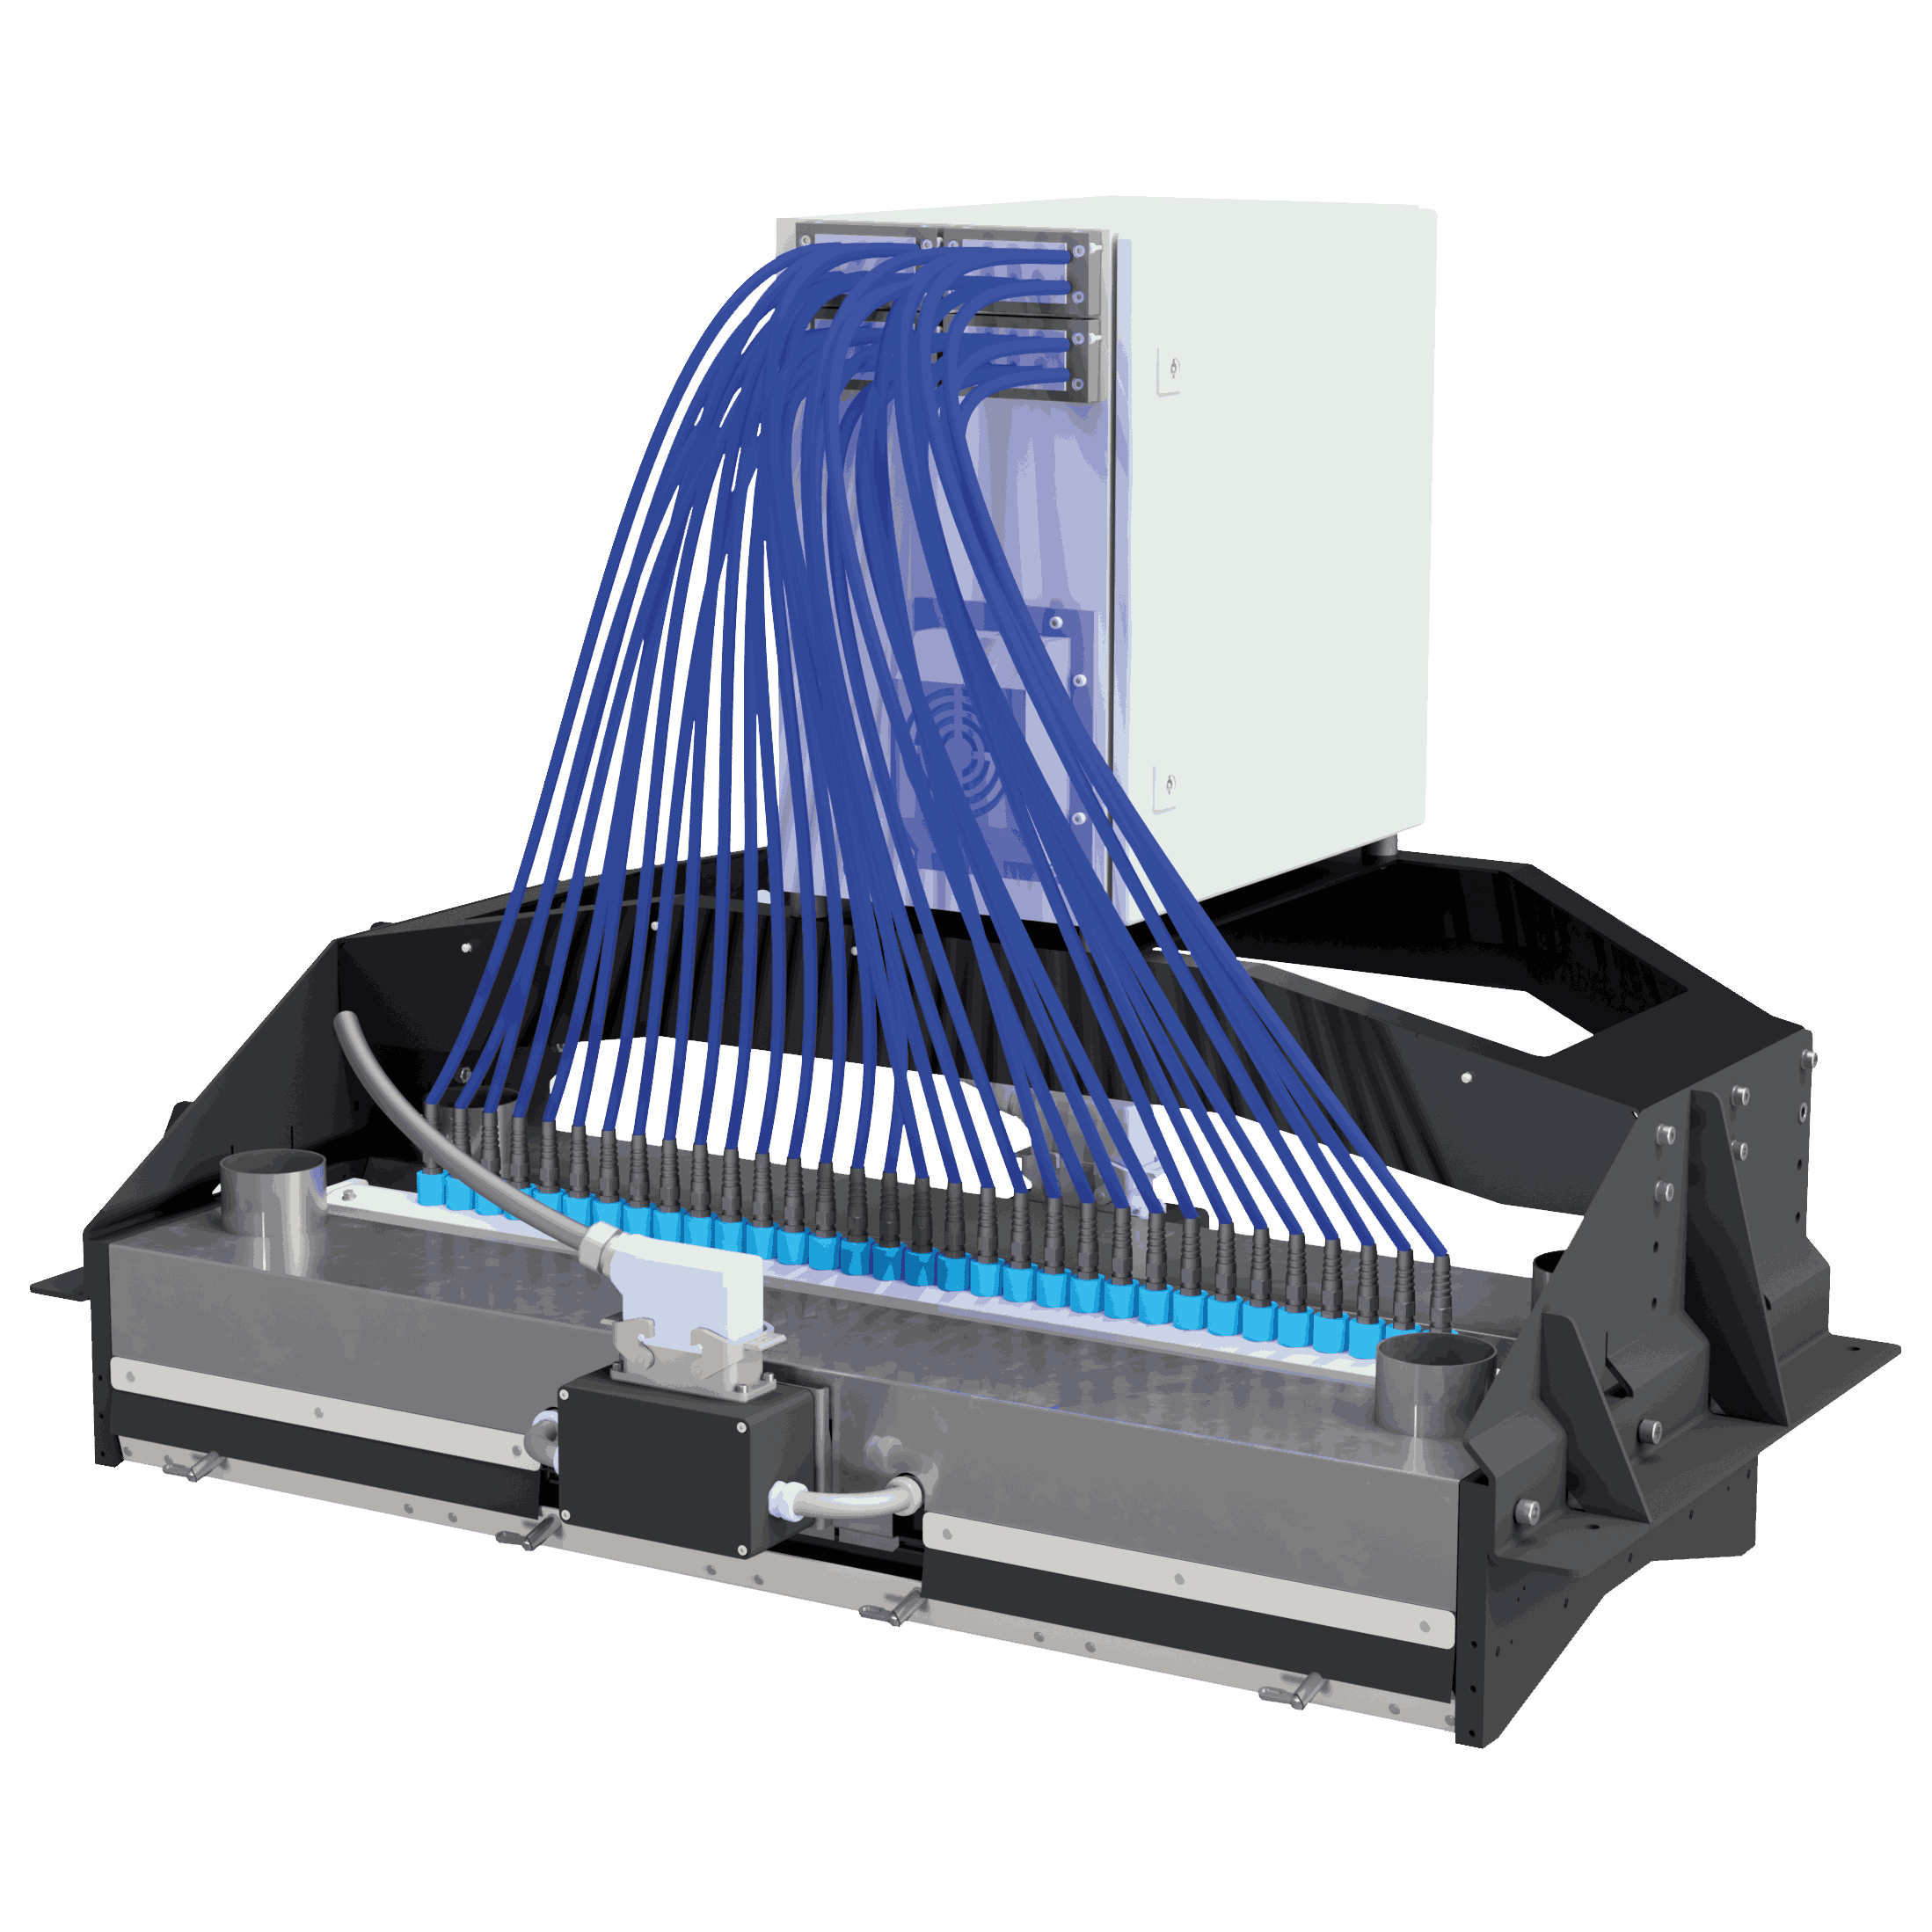
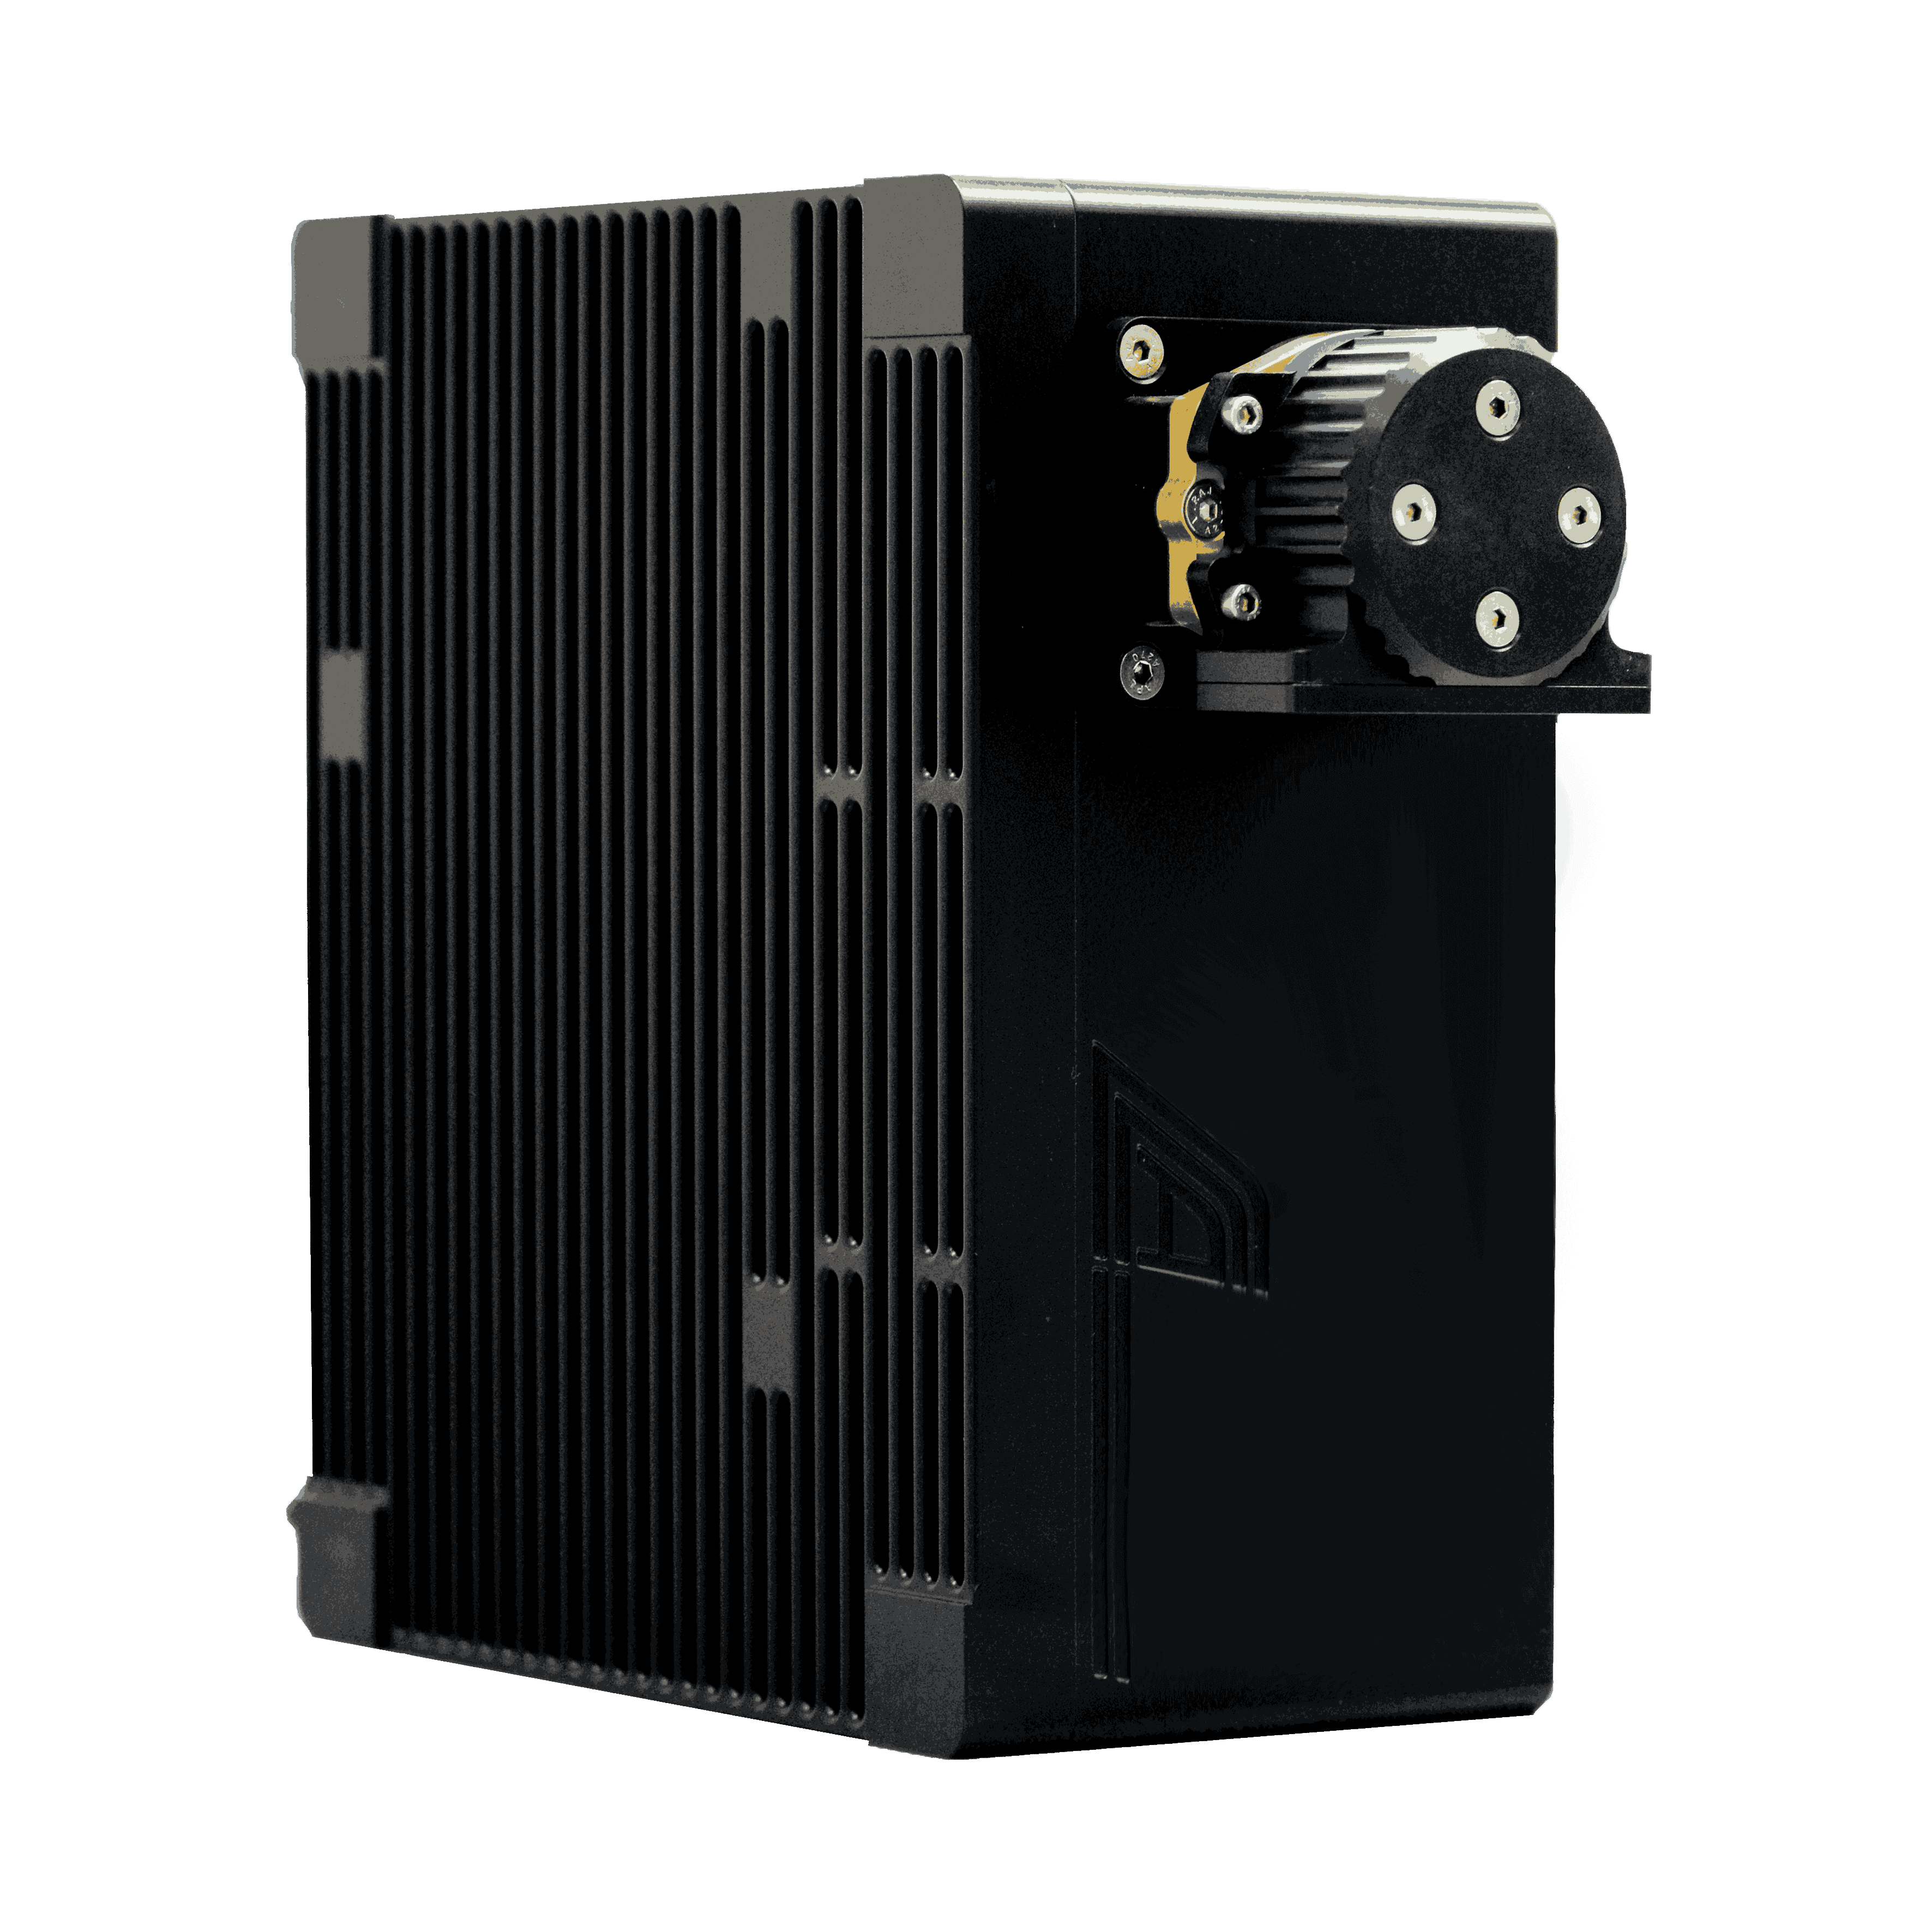
Multiplexed NIR Spectrometer
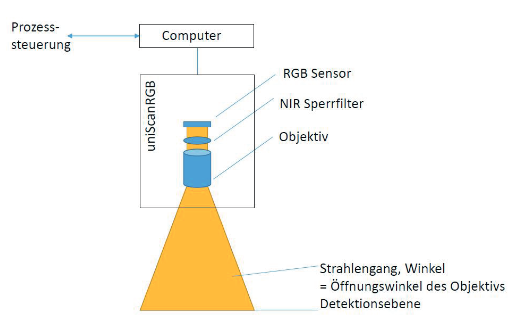
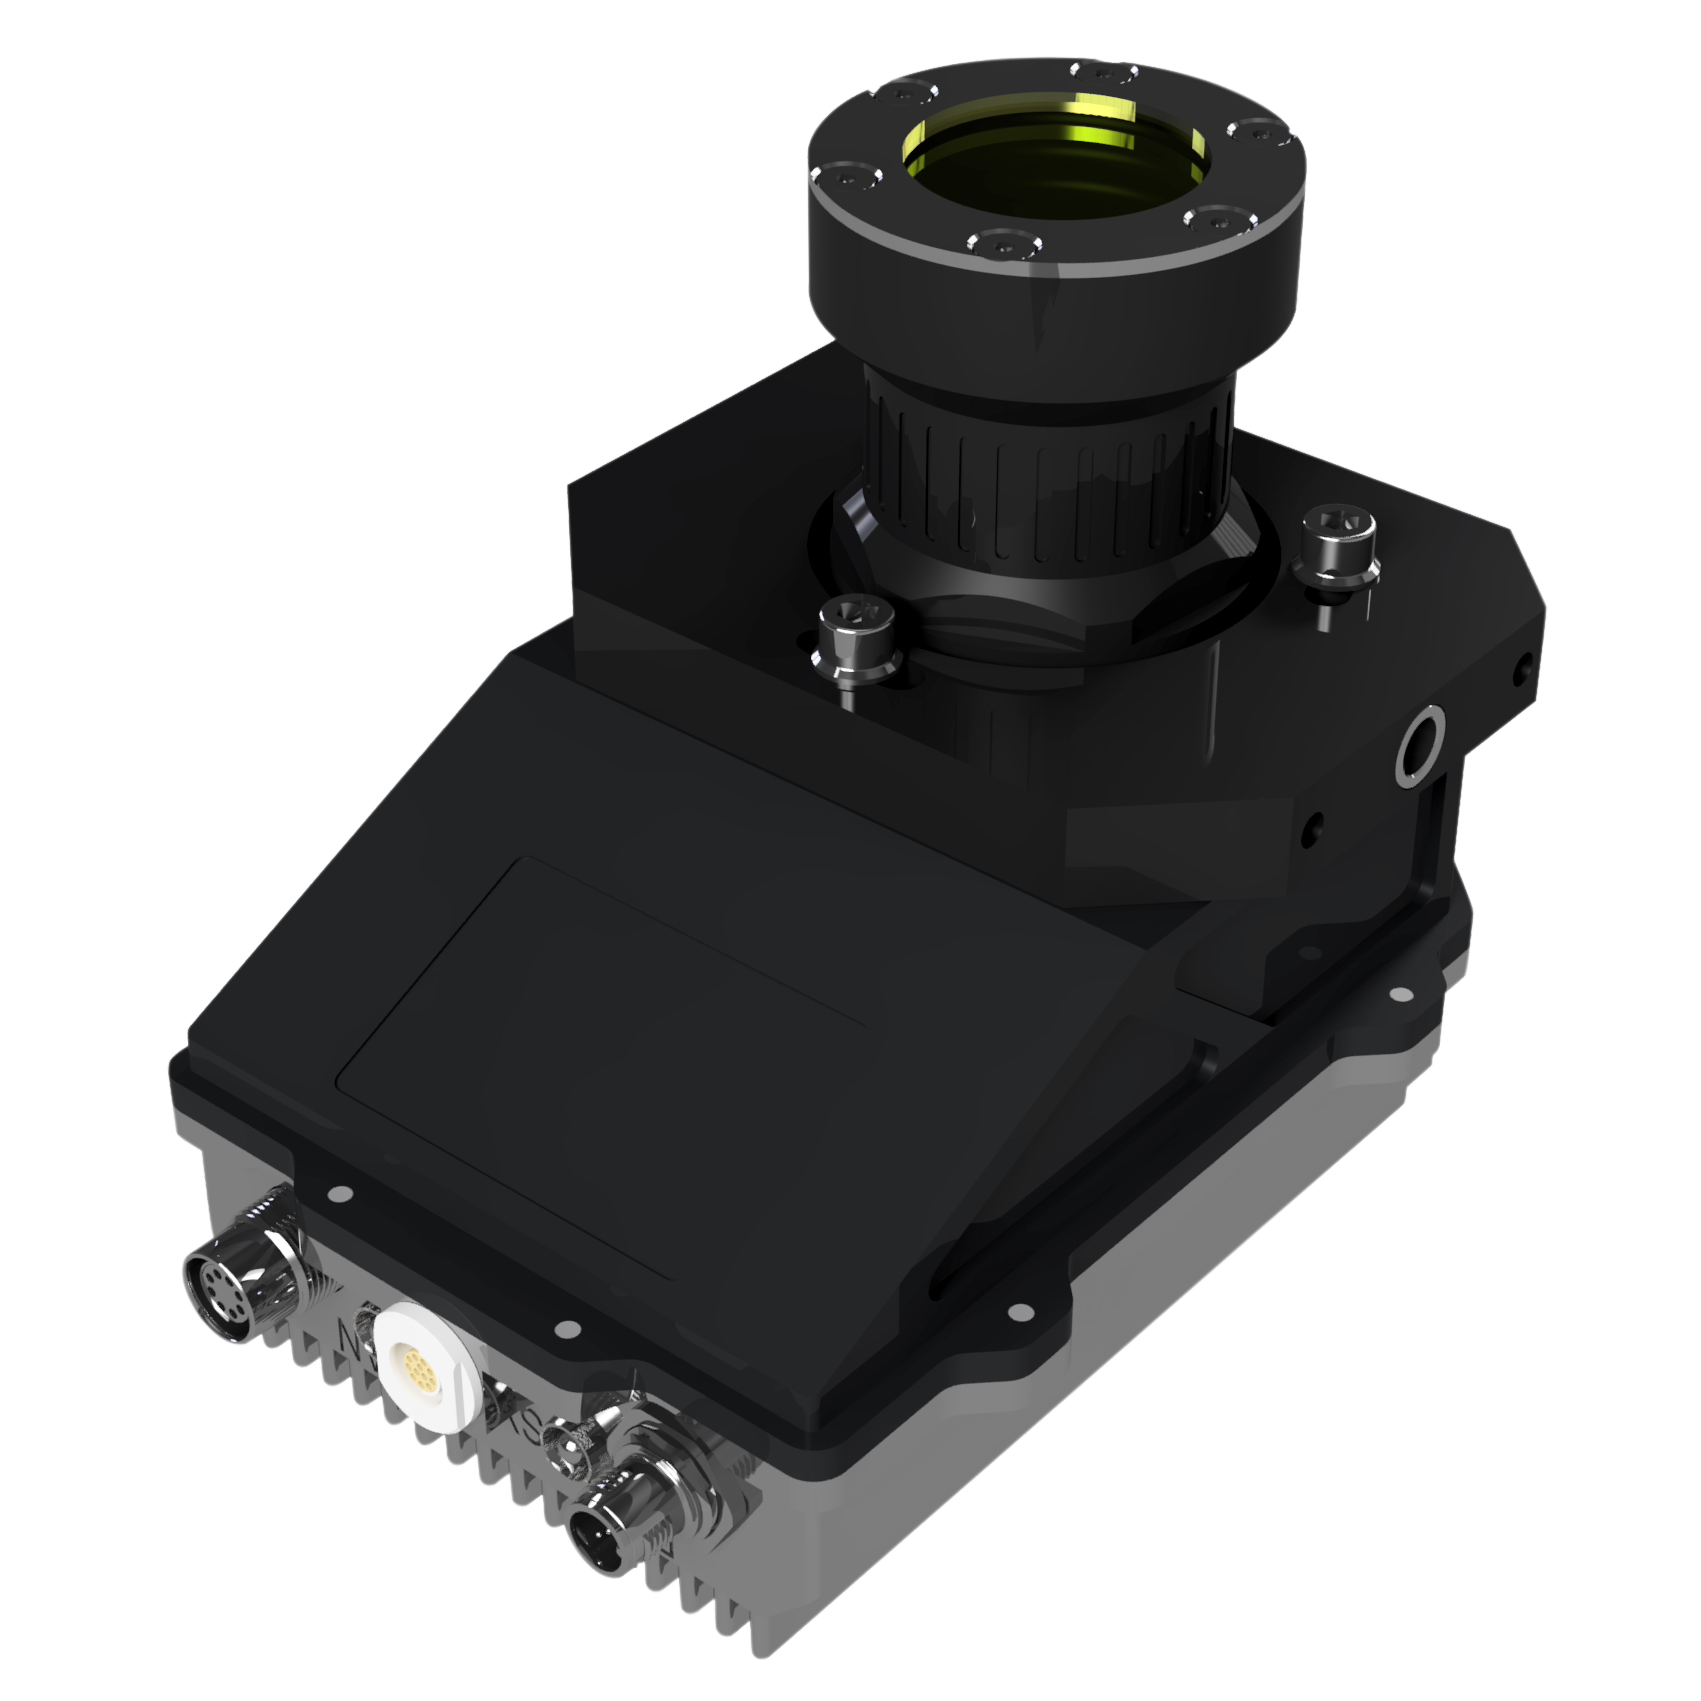
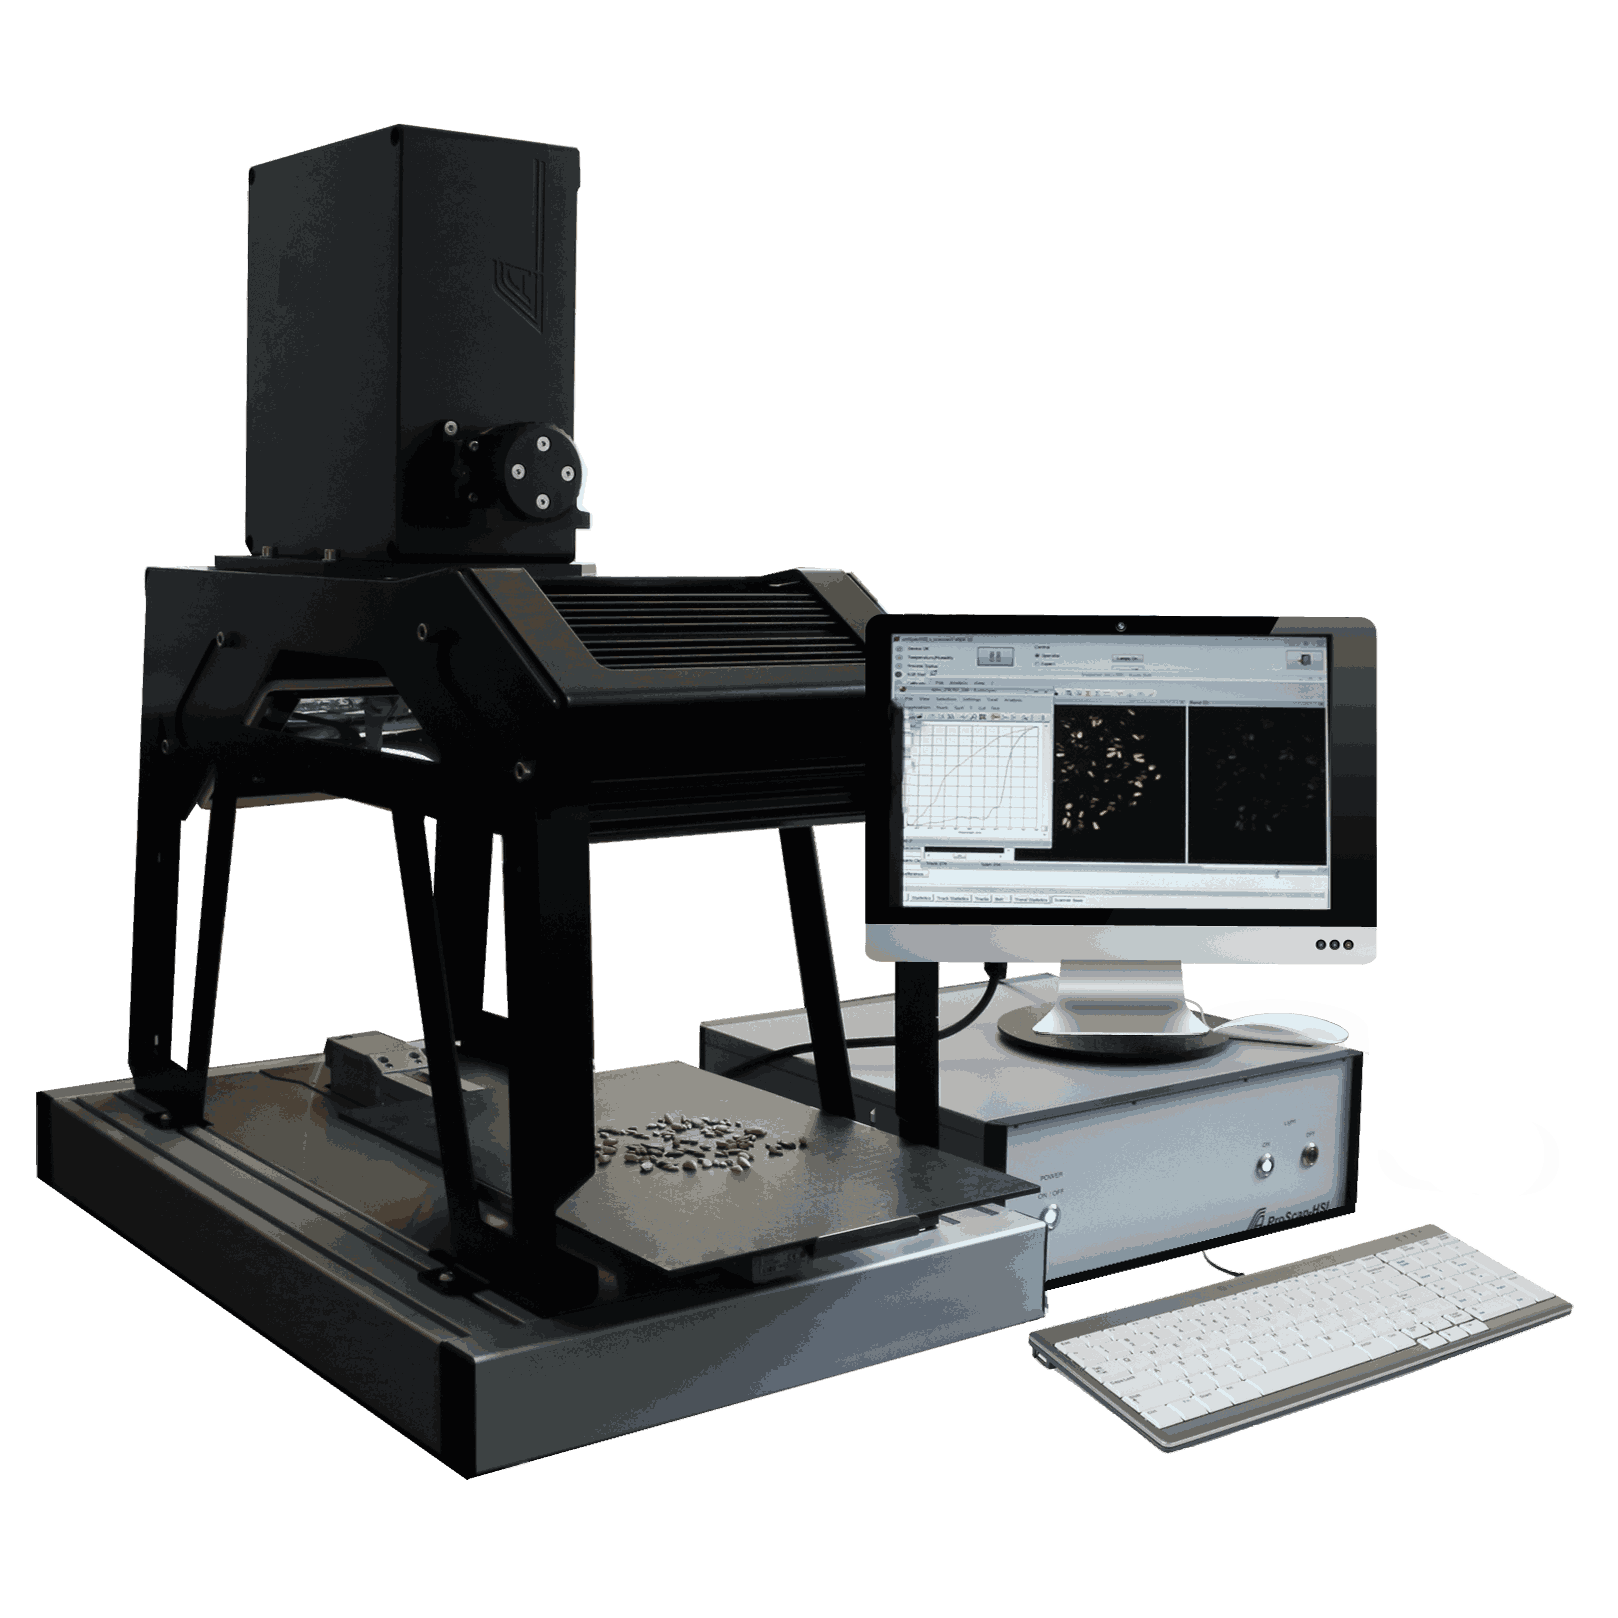
Universal line scan colour camera
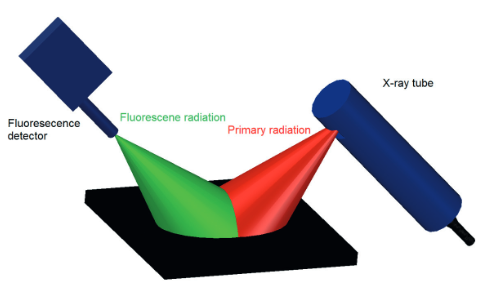
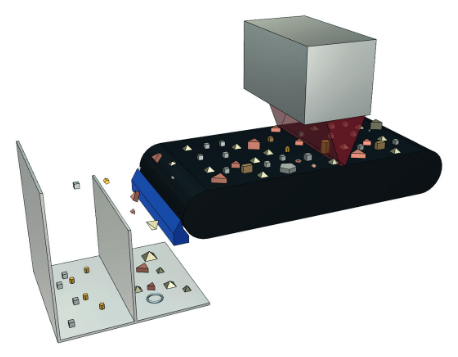
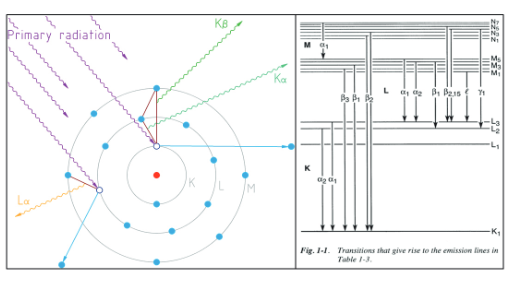
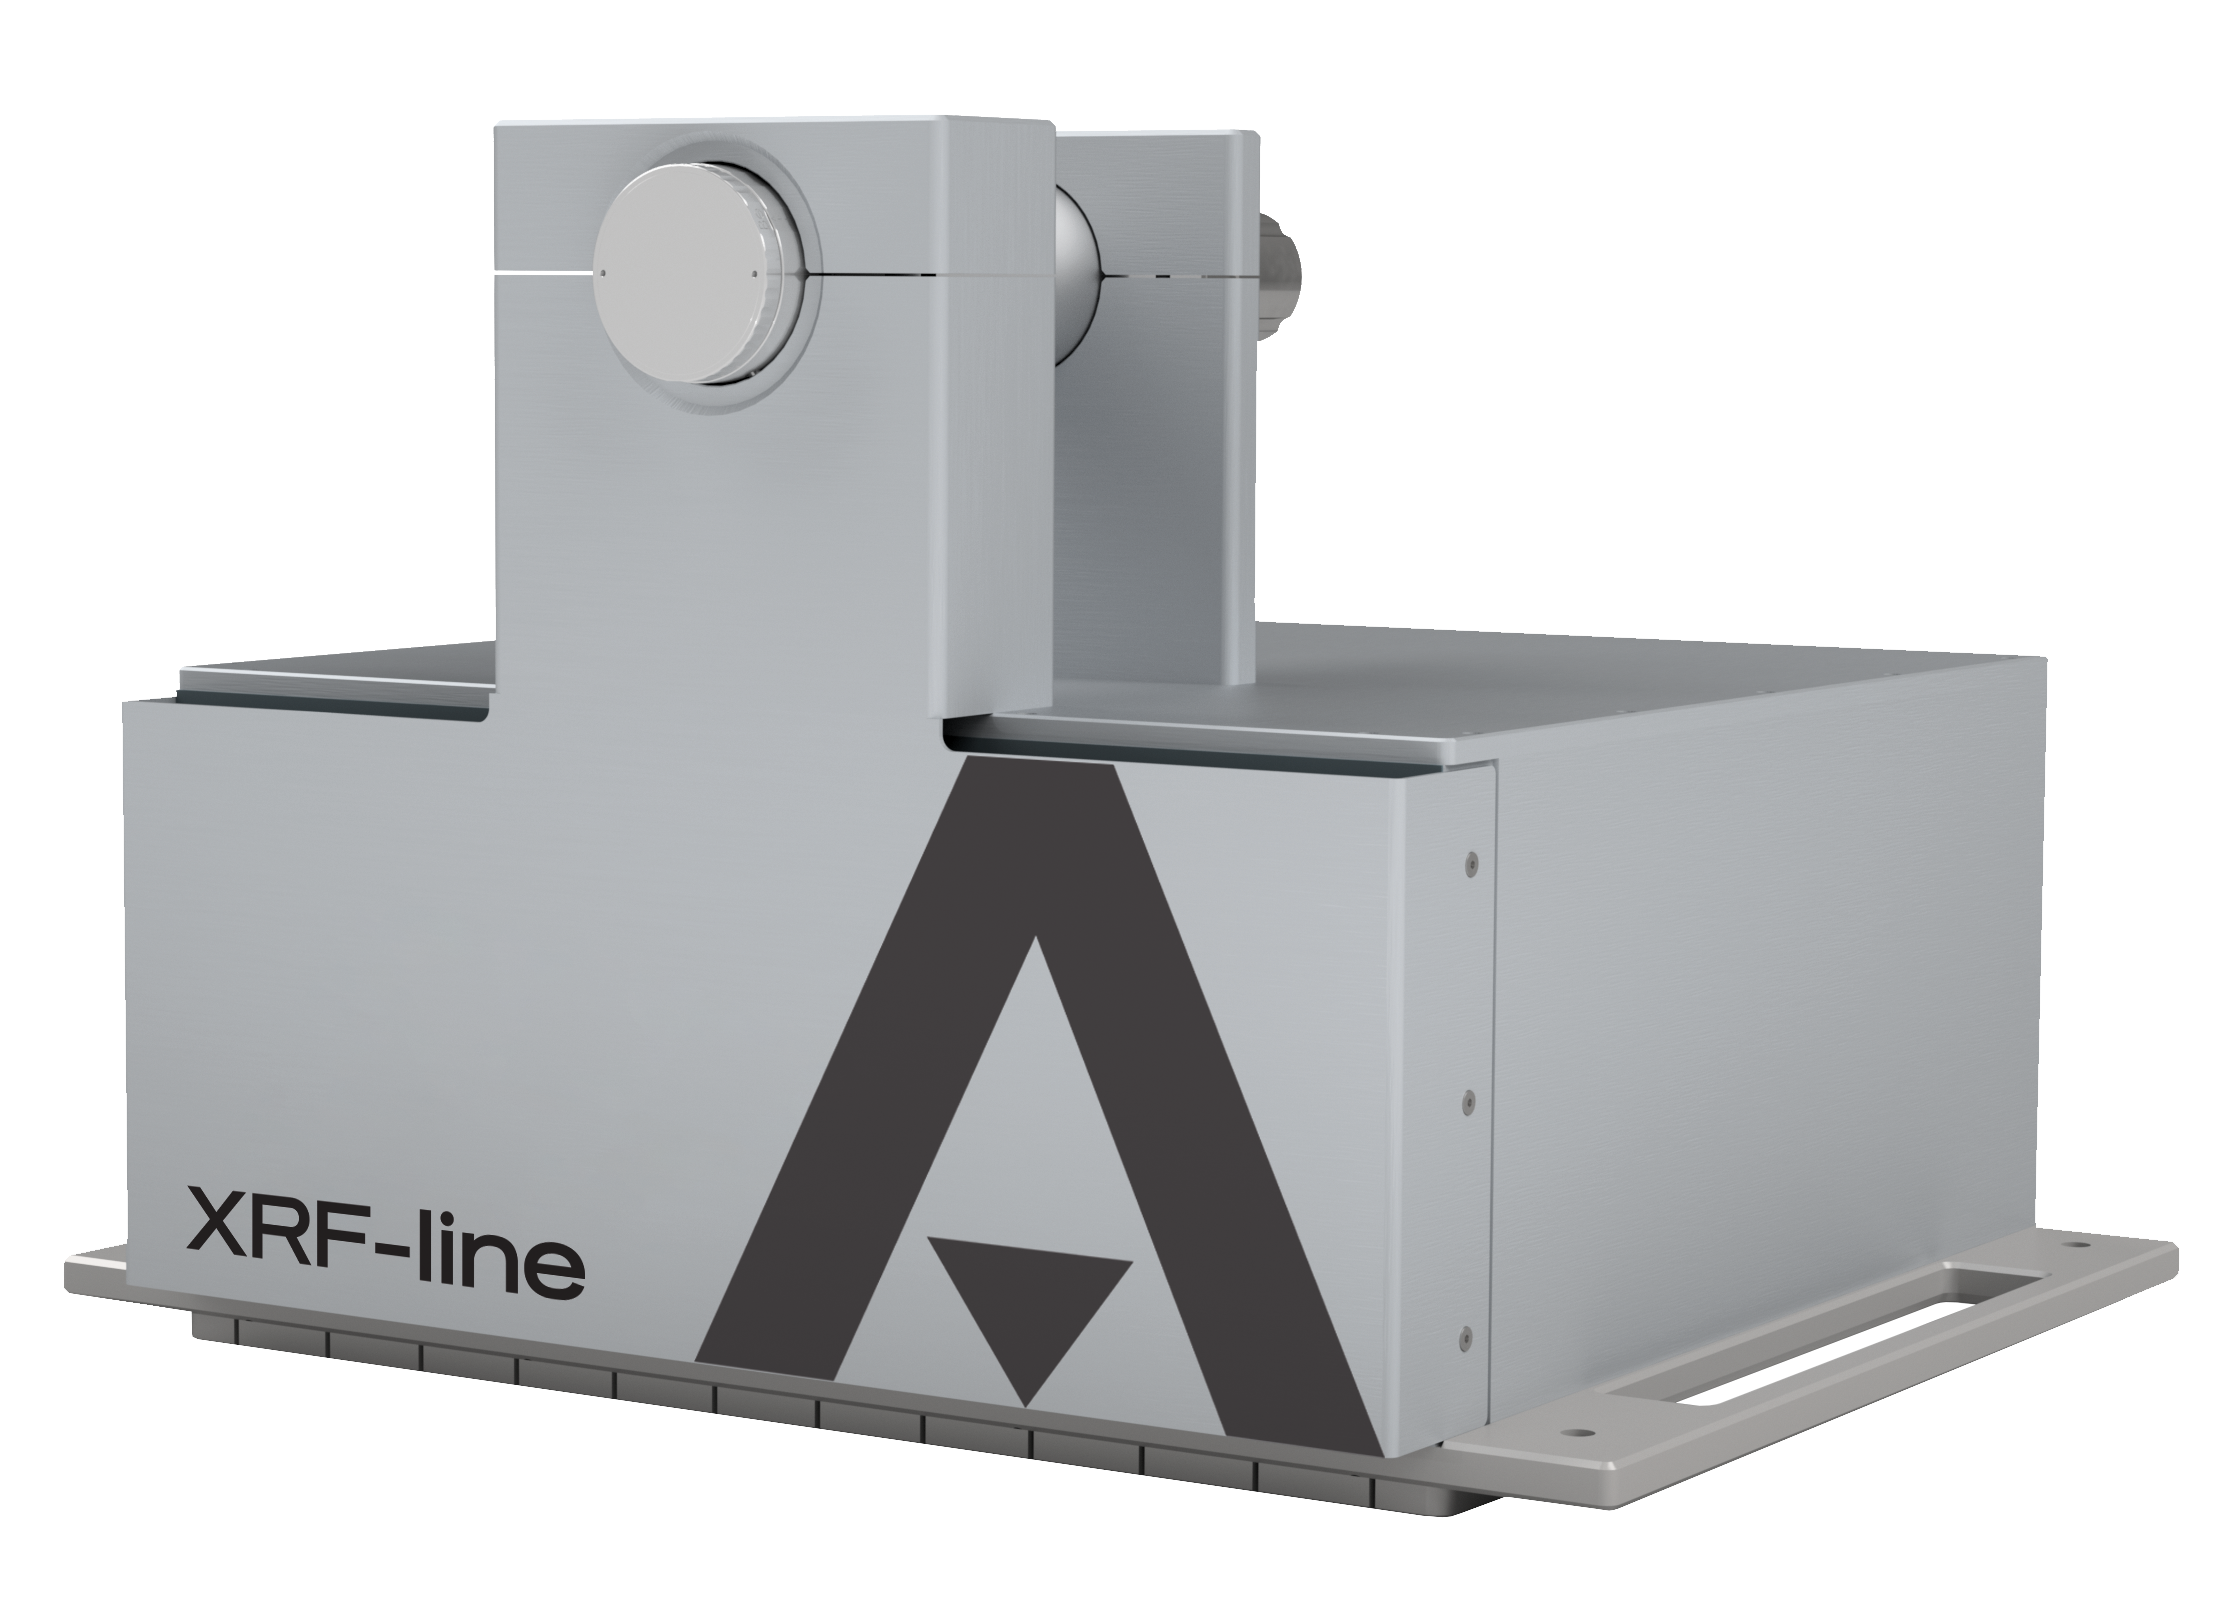
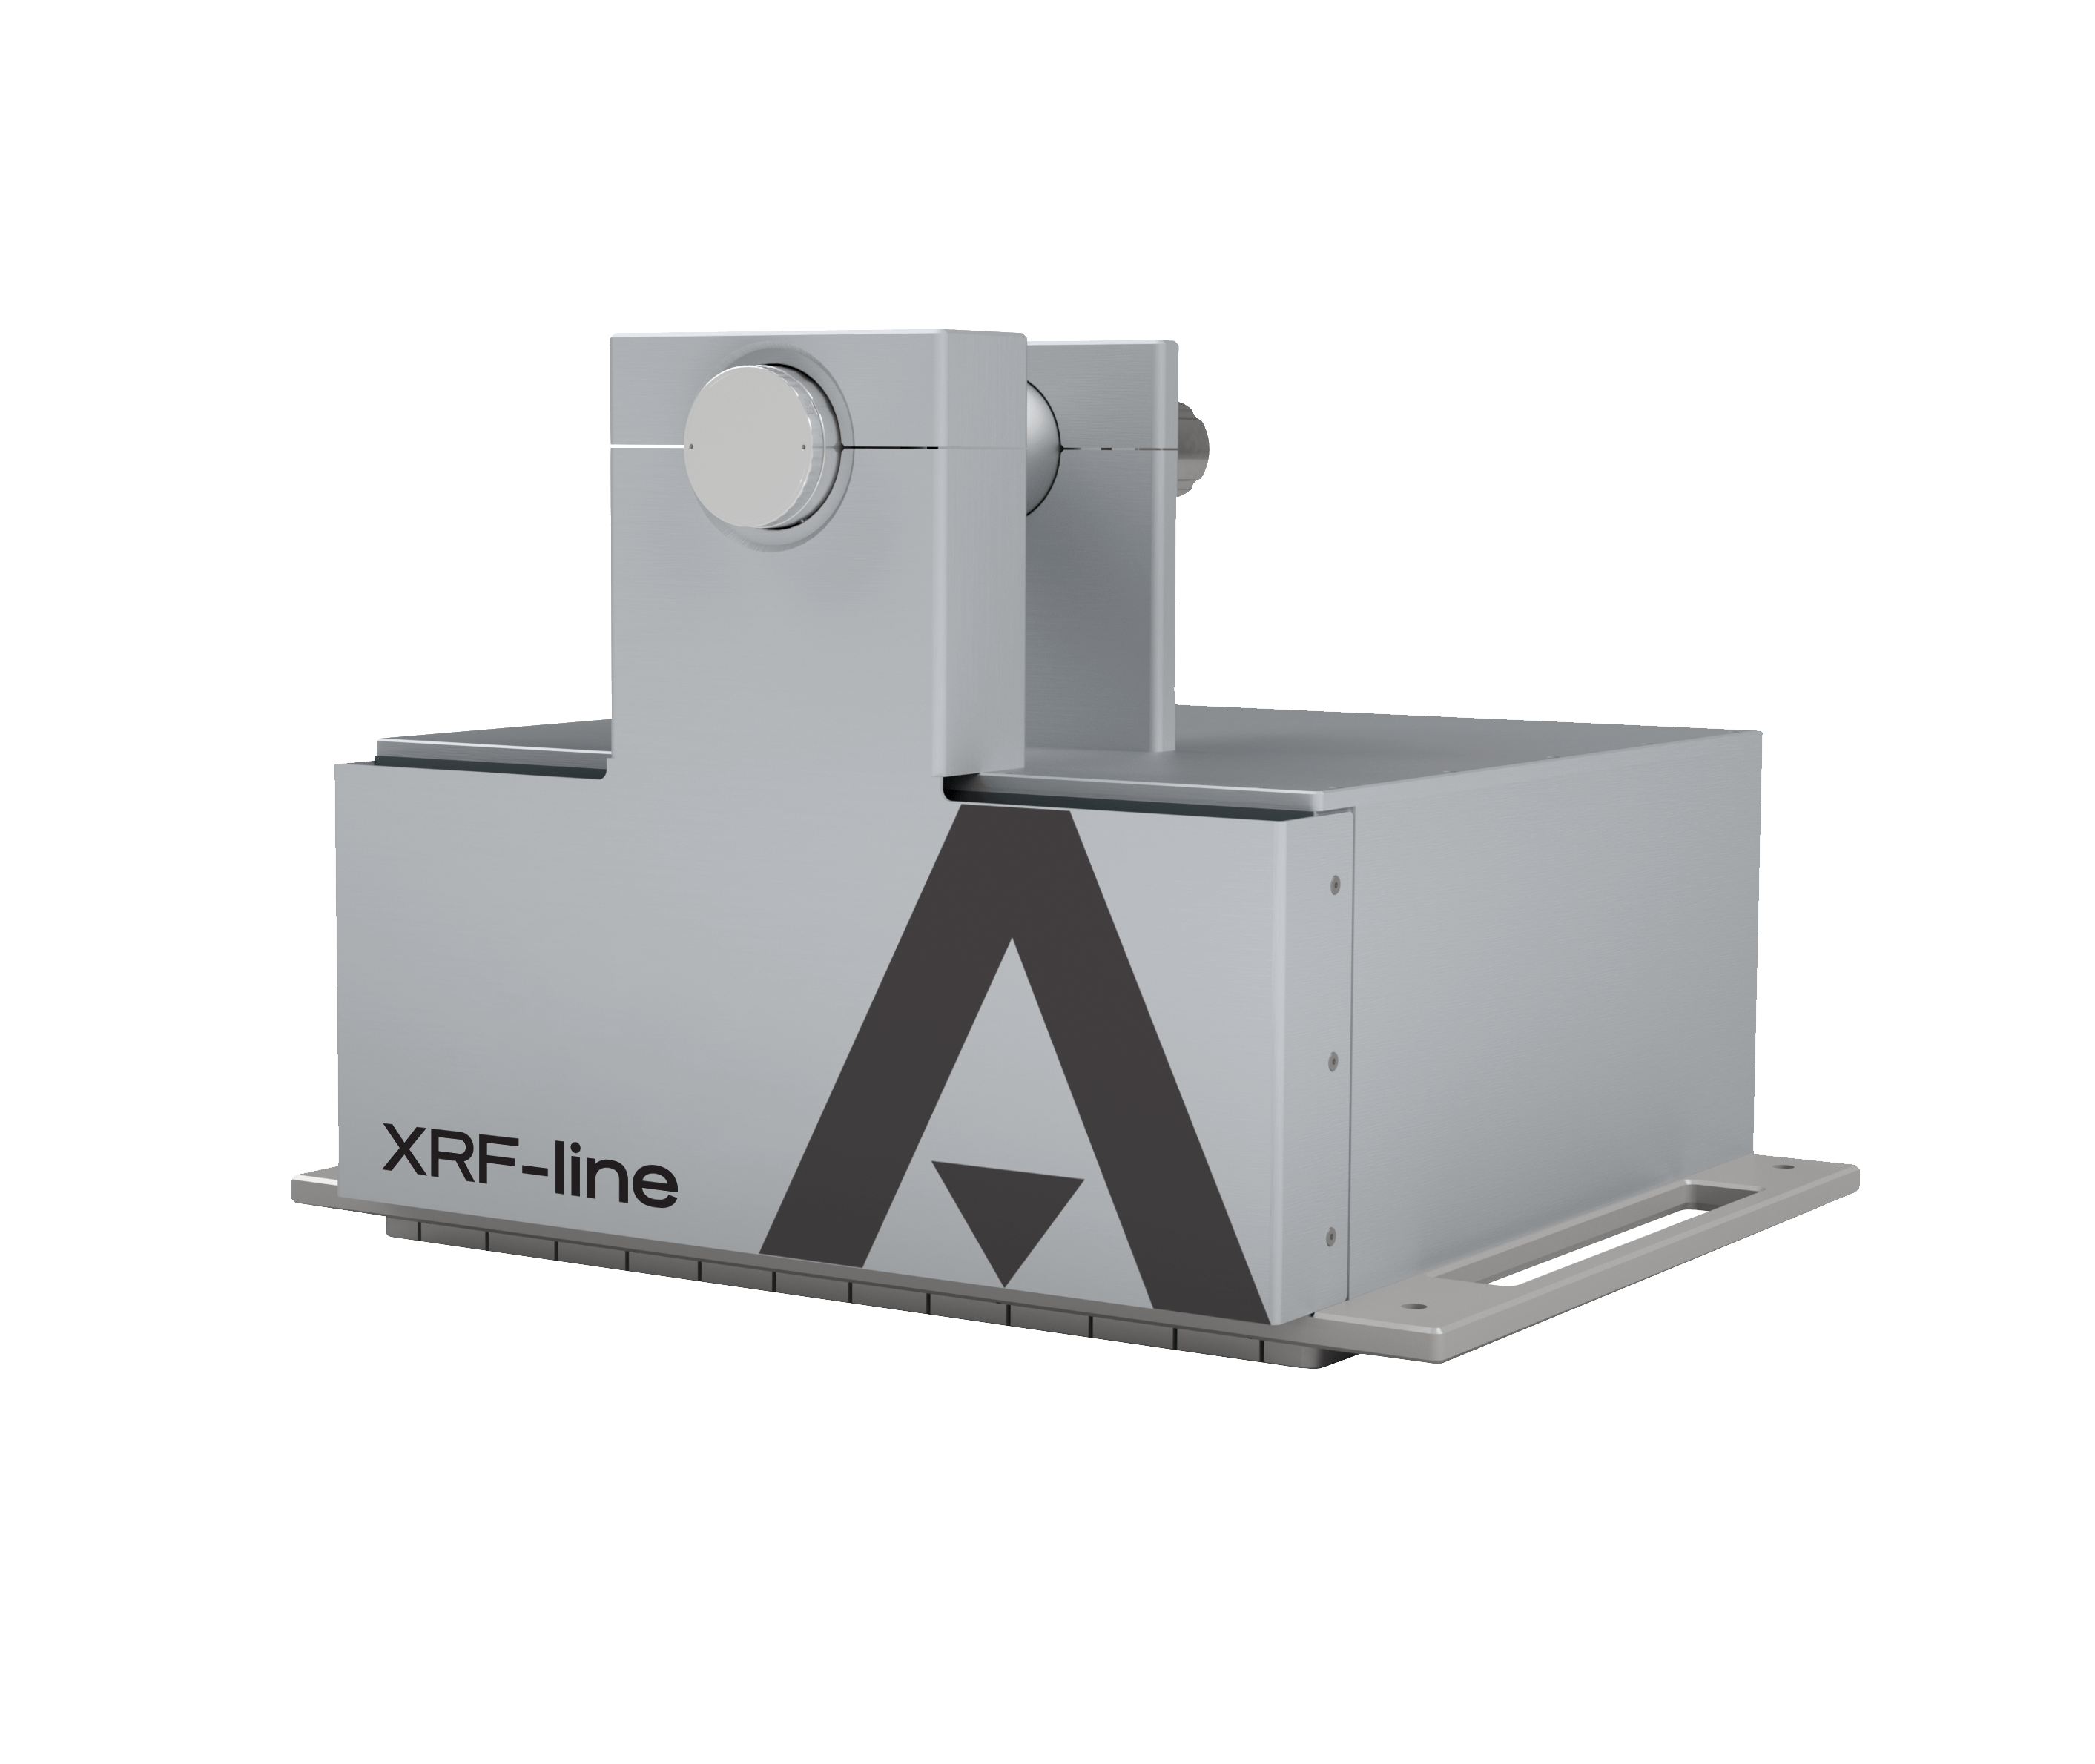
X-ray fluorescence analyser


Justus-von-Liebig
Straße 9/11
12489 Berlin
Germany